Boyer-Moore algorithm
This algorithm works checking the pattern from left to right, it is considered on of the most efficient of this area.
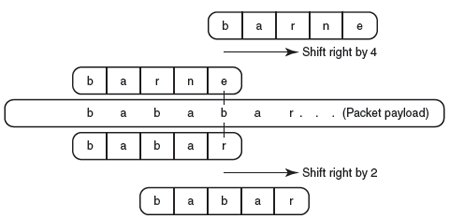
[Imagen obtenida de:"http://cdn.ttgtmedia.com/digitalguide/images/Misc/netseckia_3.gif"]
Knuth-Morris-Pratt
This algorithm uses information based on previous failures, using the information to find the very word itself contains to determine which might be the next existence, without having to analyze more than 1 time characters in the search string with.
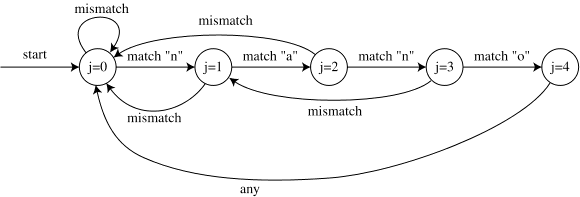
[imagen obtenida de:"http://www.ics.uci.edu/~eppstein/161/kmp.gif"]
Program code
[]
The program running:
[
max@juan-laptop:~/Desktop/octavo_semestre/teoria_info/homework2$ python homework2.py
Boyer-Moore
String: 'anita lava la tina'
Pattern: lava
Position: 6

Knuth-Morris-Pratt
String: 'anita lava la tina'
Pattern: lava
Position: 6

012345678901234567
anita lava la tina
]
Time analisys on the algorithms running
For analysis propose, i writed a códe that, measure the running time o the both algorithm using the same text, and pattern, but with diferent length of the twice variables.
The analisys works generating frst a pattern with aleatory characters, then the code put the pattern in the text, and add other aleatoy characters to fill the text.
This is the gnuplot code, i used a 3d graph because my goal is to show diferences betwen the two algorithms.
set terminal postscript eps enhanced color font 'Helvetica,40'
set output 'introduction.eps'
set size 4, 4
set xlabel 'Pattern length'
set ylabel 'Text length'
set zlabel 'time running'
set logscale
splot "time_test.dat" using 1:2:3 with dots title 'Boyer-Moore' , 'time_test.dat' using 1:2:4 with dots title 'Knuth-Morris-Pratt';
] Now the graphic shows in x and y axis the length of the pattern and text, the z-axis shows the time-running used to find the pattern in the text. is used the logscale to show more clearly the difference in the running-time.

Referencias:
http://www.wikipedia.org/

Quedó lindo. 5+5.
ResponderBorrar